Intel’s Contracts & OEM Ties Cut DSO by 33 Days: Can AMD Keep Up?
How did Intel reduce its DSO by 28 days, and can AMD, with a DSO 204% higher, catch up by implementing agile inventory management?
 Linkedin
 Facebook
 Twitter
 Copy url
20 Days
Intel outpaces AMD in CCC
204%
AMD's DSO is higher than Intel's
1.2 Times
Intel’s DPO higher than AMD’s
68 Days
AMD's average DSO

The rivalry between AMD and Intel is like an epic chess game, with each move shaking up the tech world. With processors as their pawns and knights, these tech titans constantly clash for dominance. AMD's Ryzen 9000 CPUs and Intel's Raptor Lake are now entering the scene, raising the stakes even higher.
In this article, we won't focus on raw processing power. Instead, we'll examine these two giants' financials and O2C metrics. Think of their financials as strategic plans fueling their campaigns. Who manages their resources better? Who has the edge in operational efficiency?
As we explore these metrics, you'll see how AMD and Intel stack up in technology and the financial strategies that drive their success. Let’s dive into the numbers and find out who the real winners are in this ongoing saga.
Intel outpaces AMD by 20 days in CCC
In the financial battleground of the tech industry, the Cash Conversion Cycle (CCC) of AMD and Intel tells a compelling story.
Over the past five years, Intel has consistently showcased financial efficiency. With an average CCC of 76 days, they peaked in 2023 with a remarkable 60 days. This efficiency translates to a swift conversion of resources into cash flow.
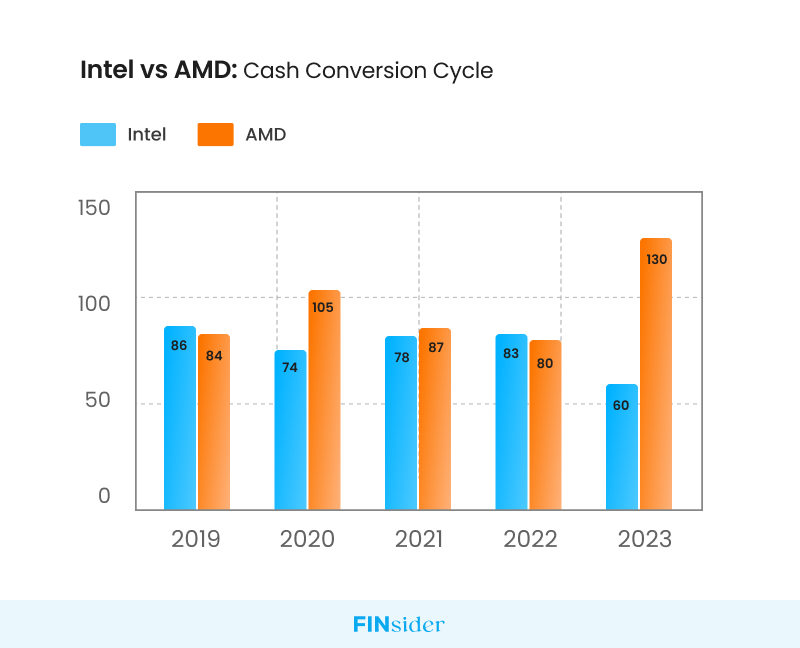
AMD, on the other hand, has had a more turbulent journey. Their average CCC from 2019 to 2023 was 97 days, showing significant variation.
However, 2023 brought improvement for AMD, reducing their CCC to 80 days. Despite this progress, they still trail behind Intel’s financial agility.
Now, let’s delve into the specific metrics—Days Sales Outstanding (DSO), Days Payable Outstanding (DPO), and Days Inventory Outstanding (DIO)—to understand better what drove these CCC scores.
Intel's DSO is 33 days lower than AMD
Delving deeper, we look at the Days Sales Outstanding (DSO) for both companies.
From 2019 to 2023, Intel’s DSO averaged 35 days.
In 2023, it was further reduced to just 25 days, highlighting efficient receivables collection.
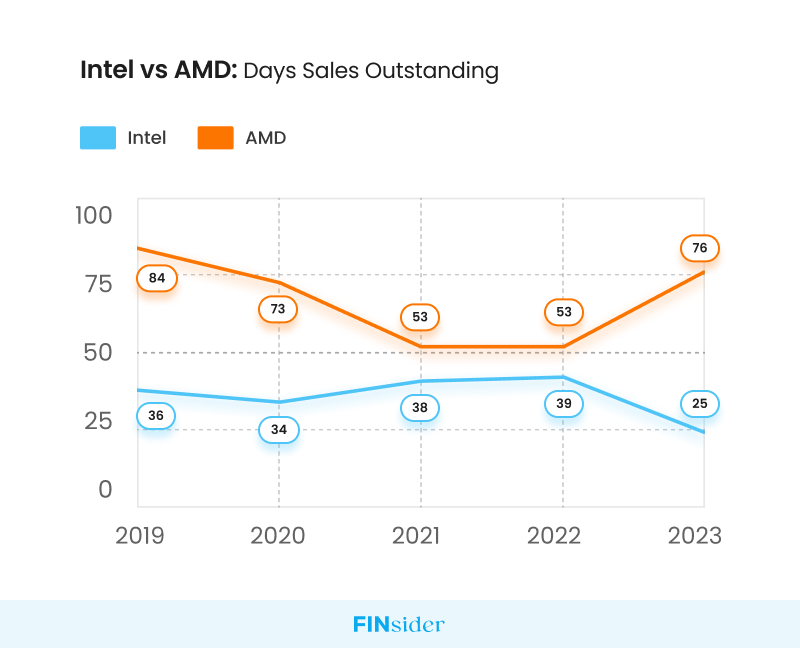
In contrast, AMD’s DSO tells a different tale. Averaging 68 days over the same period, AMD’s DSO in 2023 climbed to 76 days. This longer collection period starkly contrasts with Intel’s performance.
The difference in average DSO over five years is striking, with Intel’s efficiency making AMD’s DSO appear 94% higher.
In 2023, AMD’s DSO was 204% higher than Intel’s, emphasizing a significant gap in receivables management.
How do Intel's contracts and OEM ties lower its DSO?
Long-term Contracts with Key Customers: Intel secures long-term contracts with customers like Dell Technologies, HP, Lenovo, and Cisco. In 2021, Dell reported multi-year agreements with Intel, ensuring predictable cash inflow. Intel’s 2022 annual report showed accounts receivable of $7.4 billion and a DSO of 39 days, indicating efficient collections.
Strong Relationships with Original Equipment Manufacturers (OEMs) and Original Design Manufacturers (ODMs): Intel’s relationships with OEMs like Lenovo and Apple and ODMs like Quanta Computer involve negotiating shorter payment terms. In 2022, Intel’s top three customers, accounting for nearly 40% of net revenue, adhered to these terms, contributing to Intel’s lower DSO.
Next, we examine Days Inventory Outstanding (DIO).
Intel's DIO is 24% higher than AMD
Intel’s DIO from 2019 to 2023 averaged 109 days
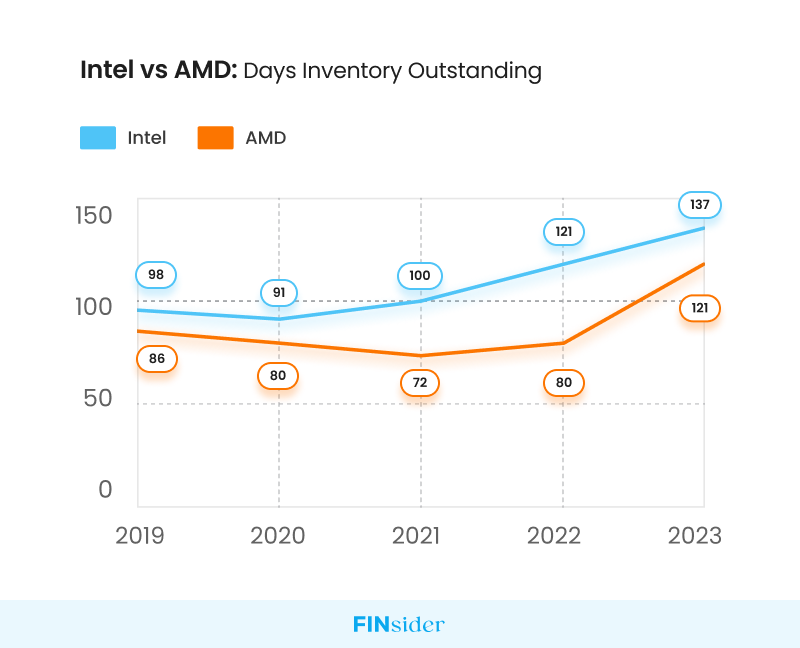
By 2023, it had increased to 137 days, indicating a longer period of holding inventory before it was sold. This is significantly higher than the industry average of 90 days.
Intel’s inventory consists of raw materials like silicon wafers, chemicals, and gases; work-in-progress products at various manufacturing stages; finished goods such as microprocessors, chipsets, and graphics processors; and spare parts for production and maintenance.
However, AMD’s DIO tells a slightly different story. Averaging 88 days over five years, AMD’s DIO in 2023 rose to 121 days. Although this was an increase, it remained lower than Intel’s.
The average DIO difference between the two companies over five years is approximately 24%.
In 2023, Intel’s DIO was about 13% higher than AMD’s, reflecting differing inventory management strategies.
How do AMD's strong sales and supply chain strategies reduce its DIO?
Increased Demand in High-Performance Segments: AMD’s high-performance computing products, especially in data centers and AI, like the MI300 series GPUs, have seen strong sales. This demand leads to faster inventory turnover, reducing the DIO as products are quickly sold.
Strategic Supply Chain Adjustments: AMD has improved its supply chain strategies post-pandemic, using advanced forecasting to match production with market demand better. Implementing VMI systems with major clients also helps AMD manage inventory more efficiently, effectively lowering the DIO by keeping inventory off AMD’s books until it’s used.
Intel's DPO is 1.2 times higher than AMD
Finally, we explore Days Payable Outstanding (DPO).
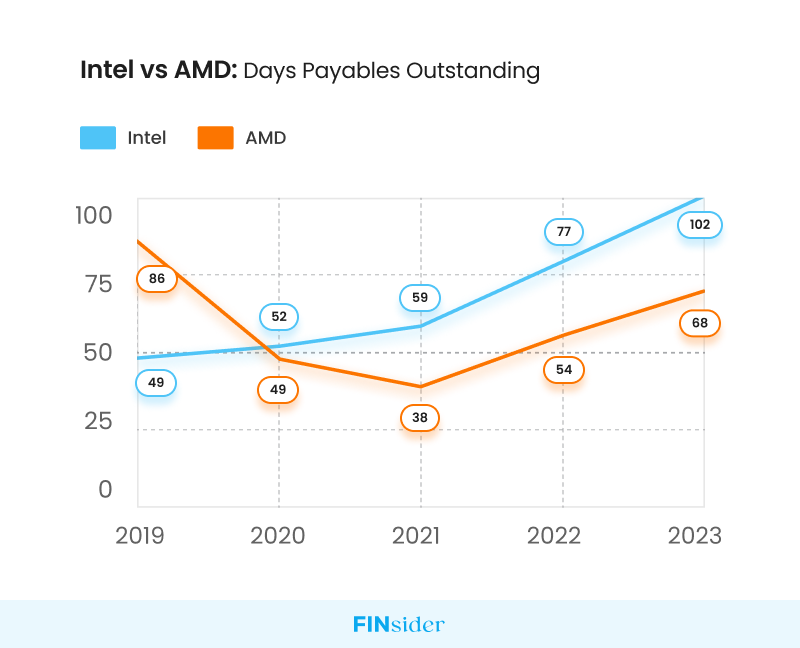
From 2019 to 2023, Intel’s DPO averaged 68 days, with a significant increase to 102 days in 2023. This suggests that Intel has been extending the time it takes to pay its suppliers.
In contrast, AMD’s DPO averaged 59 days from 2019 to 2023. In 2023, AMD’s DPO was 68 days, indicating a more consistent and shorter payment period compared to Intel.
The percentage difference in average DPO between Intel and AMD over these five years is approximately 15%.
In 2023, Intel’s DPO is about 50% higher than AMD’s, highlighting different approaches to managing payment terms with suppliers.
How do AMD's relationships with TSMC and ASMedia affect its DPO?
Dependence on TSMC for Advanced Node Production: AMD relies heavily on TSMC for its advanced semiconductor production. To secure priority access to TSMC’s cutting-edge technology amid global chip shortages, AMD agrees to shorter payment terms, ensuring a steady and reliable supply of critical components.
Partnership with ASMedia Technology: AMD maintains a strong relationship with ASMedia, a key supplier for its desktop chipsets. By paying ASMedia promptly, AMD ensures prioritized and reliable supply, which supports its expanding market share and operational efficiency, contributing to a lower DPO.
AMD vs. Intel – Who Dominates Financially?
As we wrap up this financial face-off, it’s clear both AMD and Intel have distinct strengths. Intel excels in economic efficiency, swiftly collecting receivables and leveraging extended payment terms with suppliers for operational flexibility.
Conversely, AMD’s agile inventory management and strategic supplier relationships, particularly with TSMC and ASMedia, keep it competitive despite shorter payment terms. Their high-performance products ensure quick turnover and steady supply.
Intel’s robust financial strategies and AMD’s responsive market approach showcase each company’s unique tactics.
Intel’s financial agility slightly edges out in this ongoing rivalry, but AMD’s strategic growth and partnerships signal a strong contender. As these tech giants push forward, their financial maneuvers will continue to shape the industry’s future.


