Navigating the Meta Maze: A Strong Financial Come Back!
Ready to unravel the magic at Meta's financial crossroads? Grab a seat as we dish out the juicy details behind Meta's seamless blend of financial flair and tech brilliance!
2X
growth in revenue between 2018-2022
72%
rise in operating cash flow
2.3X
longer DPO in 2022 than in 2018
2022
saw a decline in revenue for the first time

In the dynamic realm of technology, Meta isn't just a giant; it's a transformative force shaping our digital connections. Beyond the realms of virtual reality and the social media universe (think Facebook, Instagram, WhatsApp, and more!), Meta's financial engine is the powerhouse driving its rapid growth.
Our deep dive takes you behind the scenes, peeling back the layers of Meta's financial symphony. We'll dissect the strategies behind Meta's cash flow and delve into the working capital metrics that underpin its financial prowess. Together, we'll decode Meta's Days Sales Outstanding (DSO) and Days Payable Outstanding (DPO), unraveling the financial tapestry that makes Meta a true titan in the tech world.
So, welcome to Meta's financial playground – a space where innovation and liquidity join forces to craft a tech powerhouse that goes beyond the ordinary. Get ready to explore the financial heartbeat of Meta, where every number tells a story of innovation, growth, and resilience.
2023: The Year of Efficiency
Meta started 2023 with some tough decisions relating to restructuring its business to reduce costs and improve efficiency.

Meta’s CEO, Mark Zuckerberg, dubbed 2023 the year of efficiency as the company prepared to make a financial comeback after poor results in 2022.
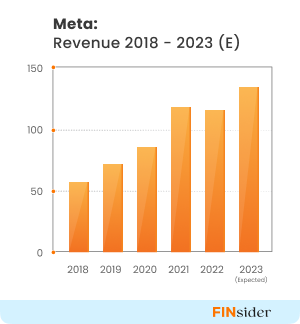
Meta posted its first-ever revenue decline in Q2 2022. It also ended the year with a 1% revenue decline (see graph).
Free cash flows decreased by 52% YoY in 2022, driven by higher capital and operating costs and economic headwinds.
But 2023 was expected to be a stronger year for Meta (annual financial results would be available in Feb 2024), with revenues expected to grow by almost 14% YoY. Meta also posted its highest quarterly FCF ($13.6 Bn) in Q3 2023, indicating a strong financial year.
Steady DSO despite challenges
Despite facing pressures on its sales, net income and other financial metrics, Meta’s ability to collect payments from customers on time hasn’t been affected much.
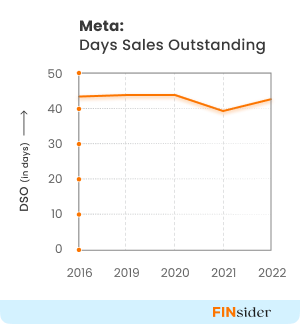
Their Days Sales Outstanding (DSO) has remained steady through 2018 – 2022. Though the DSO saw a significant 5-day decrease in 2021, likely driven by the economic recovery immediately after COVID-19, it returned to its average levels in 2022 (see graph).

Here’s a quick look at its DSO figures:
- Lower DSO than the industry average: Meta’s average DSO for the last five years (43 days) is slightly better than the industry average of 46 days.
- DSO in 2023 further improved: For the first three quarters of 2023, Meta’s average DSO was 36 days. The overall DSO for 2023 is expected to be lower than in previous years due to stronger collection efforts driving efficiency.
Accounts Receivable Turnover Ratio Improves by 17%
Meta saw its Accounts Receivable Turnover (ART) ratio improve by 17% between 2018 – 2022, reaching 8.7.
A 2% reduction in its receivables to sales ratio in 2021 compared to previous years has helped drive this improvement.
Meta’s ART is comparable to that of competitors like Google, which has a ratio of 8. Meta’s ART is expected to increase further in 2023 as its DSO reduces and liquidity at customers’ end improves due to better economic conditions.
Meta faces negligible credit loss risk
Meta believes that its accounts receivable assets (~14 bn dollars) are at very negligible risk from non-payment.
Its credit loss allowance has been nominal in the last two years.
A factor driving the lower credit risk could be the geographic spread of its customers. Almost 40% of its receivables are held within the US while the majority of those from outside the U.S. are in Western Europe, Canada, Japan, Australia, China and Brazil.
Also, none of its customers represents more than 10% of its total revenues, signifying low customer concentration risk.
DPO Grows More than 2X Between 2018 - 2022
Days Payable Outstanding (DPO) indicates the average number of days a business takes to pay its suppliers.
A longer DPO indicates that the company pays its suppliers later, thus holding cash in hand for longer.

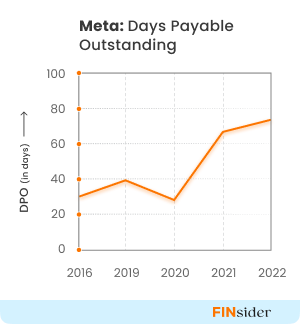
Here’s a quick look at its DPO figures:
- Increase in DPO: Meta’s DPO was 32 days in 2018. By 2022, it had jumped to 72 days (see graph). Except for a decrease in 2020, most likely due to COVID-19-related economic conditions, Meta’s DPO has been consistently rising.
- Higher DPO than competitors: Meta’s DPO is longer than that of competitors like Google (18 days) and SNAP (19 days).
Globally spread suppliers, especially those outside the US, likely enable Meta to have an upper hand in credit term negotiations and payments.
In line with its DPO, Meta’s accounts payable turnover ratio also declined by over 55% during 2018-2022. Its total accounts payable as of Dec 31 2022 was $4.99 Bn and its payables turnover ratio was 5.06.
Meta Achieves a Negative Cash Conversion Cycle

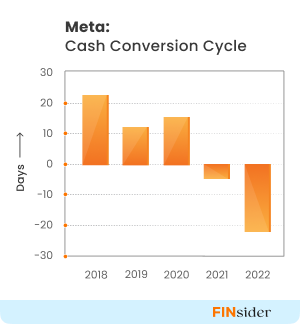
In 2018, Meta’s Cash Conversion Cycle (CCC) was similar to the industry average of ~20 days.
But Meta has steadily improved its CCC (see graph) since then. From 2021, Meta has reported a negative cash conversion cycle, essentially getting financed by suppliers!
Meta’s Days Inventory Outstanding (DIO) levels have remained at near zero levels. With its DSO also remaining almost the same across the last five years, DPO has been the main driver enabling Meta to keep cash in hand for longer.
Despite the shorter cash conversion cycle, Meta’s operating cash flow and FCF were lower by 12% and 55% YoY in 2022 due to higher operating expenses.
The Way Forward In 2024
Meta’s efforts to become more efficient in 2023 seem to have paid off. Meta’s quarterly operating expenses in 2023 have been lower YoY.
Meta expects total expenses for 2023 to be in the range of $87-$89 billion, lower than their previous estimate of $88-$91 billion. Analysts also predicted that revenues will grow to $133 billion in 2023 and $150 billion in 2024.
But Meta expects cost pressures to persist in 2024 due to investments needed to power growth as competitors like Google, Dash, and Microsoft pump in money to gain hegemony over AI and other emerging technologies.
- Meta expects higher infrastructure-related costs in 2024, both in terms of operating and depreciation costs.
- Meta looks to ramp up hiring in higher-cost technical roles, potentially leading to payroll cost pressures
- Operating losses in its Reality labs (virtual reality/ augmented reality solutions) to increase due to ongoing product development efforts.
Conclusion
Meta has navigated through financial headwinds in 2022 and positioned itself more securely in 2023. From this position, Meta looks more empowered to compete with competitors to deliver new product offerings that are packed with AI and other latest technologies.
Meta’s cash flow and working capital metrics have improved through 2023 and look set to help the company achieve its 2024 goals and gain an edge in the AI-based software services market.
 Linkedin
 Facebook
 Twitter
 Copy url


