Apple's Treasury Management: The Hidden Mastery
Discover why Apple’s treasury enjoys $100Bn in free cash flow, hedges 96% of its overseas sales and skillfully mitigates forex risk, and maintains a stellar debt-to-equity ratio at 0.81, leveling the industry standard.
$0.81
of Debt for Every Dollar of Equity On Average
$145 Bn
in Current Liabilities in 2023
63.8%
of Net Sales from Outside the US in '23

When it comes to technology and business, few names carry as much weight as Apple. With its impressive annual revenue of $383Bn and global presence spanning over 150 countries, Apple is not only a technology giant but also a financial heavyweight when it comes to treasury and cash management.
What makes Apple stand out? From efficiently managing their Free Cash Flow (FCF) near the $100 billion mark year-on-year to using advanced hedging techniques to mitigate 96% of the currency risks, Apple's treasury management techniques have set a standard for others to follow.
In this article, we delve into some of the trends in Apple's treasury management. Our analysis includes an examination of Apple's Free Cash Flow, Liquidity Ratios, and Debt-to-Equity Ratio, which we compare with industry averages.
Furthermore, we take a closer look at how Apple tackles foreign currency risk. This involves the strategies for mitigating potential losses from fluctuations in exchange rates, which is critical for a multinational corporation like Apple, as it operates in multiple currency zones.
Let's start by analyzing the FCF first and see what we can observe!
Apple Leads with 1.3x Average FCF of Big Tech
Free Cash Flow (FCF) provides insight into how much cash the business has available to pay its creditors, as well as to investors as dividends. For our analysis we’ll compare Apple’s performance with Microsoft and Alphabet. Together, these three are the world’s top three most valuable companies.
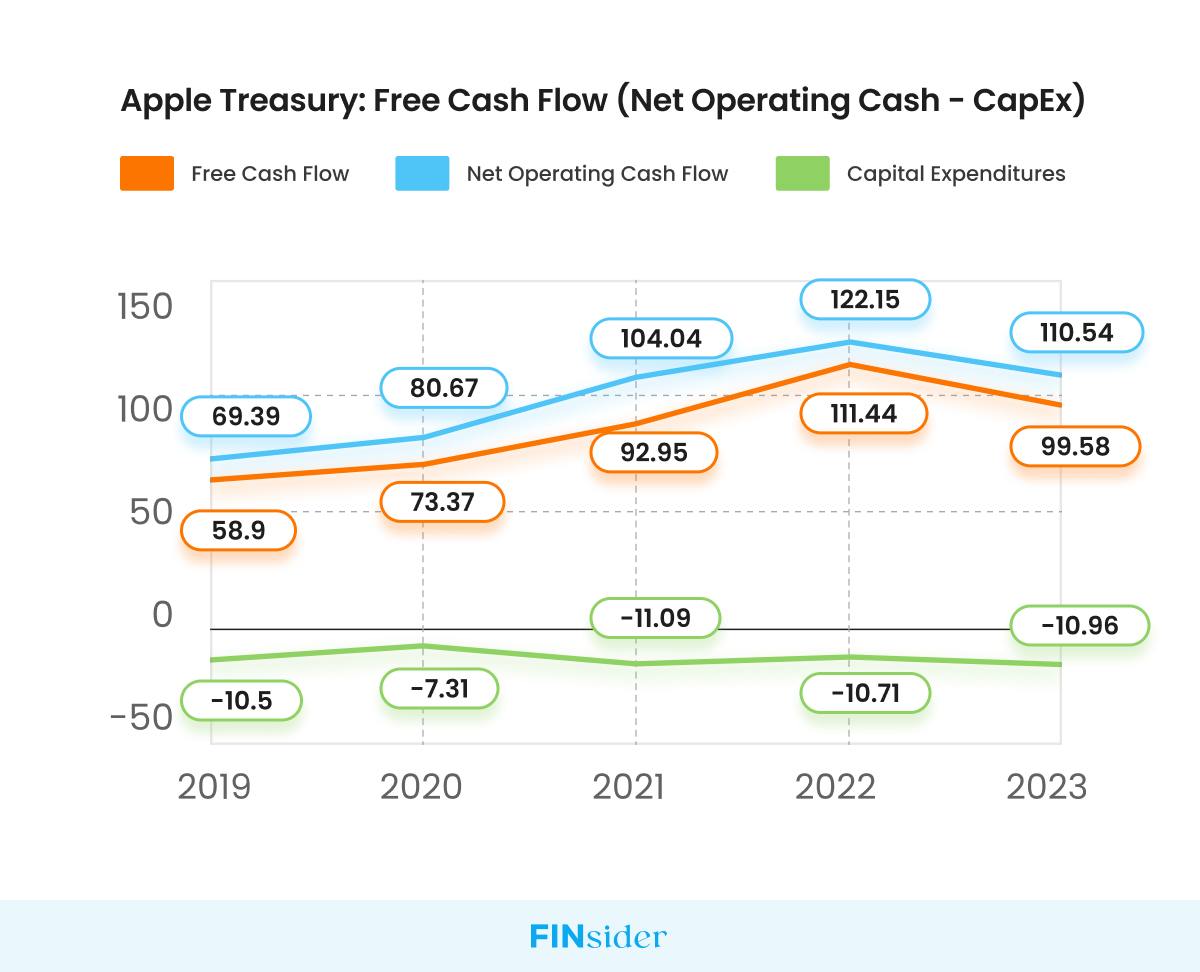
- In 2023, Apple’s FCF was at $99.58 billion. In comparison, Microsoft and Alphabet had FCFs of $59.48 billion and $69.5 billion, respectively. The industry average comes out to be $76.19 billion.
- Although Apple’s FCF grew at a CAGR of 14.03% (from 2019 to 2023), in 2023 we saw a decline when it fell to $99.6 billion from $111.4 billion, a decrease of 9.5%.
To get to the bottom of this decrease in FCF, let’s dig deeper into Apple’s Cash Flow Statement. We observed that, while Apple’s Capital Expenditure has remained relatively stagnant throughout the years, a substantial decline in Net Operating Cash Flow has occurred.
This anomaly demands a deeper analysis!
Why did the Net Operating Cash Flow decrease by 9.5% in FY 2023?
An increase or decrease in a company’s Net Operating Cash Flow is closely related to its performance in the consumer market, specifically its Sales/Revenue. In 2023, Apple’s Net Sales decreased by 2.80%.
- According to CNBC, this decline could be due to various factors, such as slower sales for phones and computers, as well as company-specific issues such as the absence of new iPad models in 2023 and weak demand in the market for wearable products like Apple Watch.
Apple’s Liquidity Metrics Fall Below the Industry Average
All three key liquidity metrics, namely the current ratio, quick ratio, and cash ratio, have been on a declining trend for the past five years for Apple. In comparison, Microsoft and Alphabet have been maintaining their liquidity ratios much better than Apple, keeping ratios above the industry average (from 2019 to 2023).
- In 2019, Apple had a current ratio of 1.54, indicating a sufficient amount of current assets to cover its liabilities. However, in 2023, this ratio declined to 0.99. Despite having an average current ratio of 1.17, Apple still lags behind the industry average of 2.02.
- Similarly, the quick ratio, which excludes inventory from current assets, decreased from 1.5 in 2019 to 0.94 in 2023. While Apple averages a quick ratio of 1.12, it still trails the industry average of 2.
- Even the cash ratio, the most conservative measure, shows a decline from 0.95 in 2019 to 0.42 in 2023. Although Apple averages a cash ratio of 0.61, it falls below the industry average of 1.38.
One of the major factors contributing to the continuous decrease in all three ratio values is a constant surge in current liabilities. In fact, Apple’s current liabilities have been increasing year on year at a CAGR of 6.6% since 2019. The only exception was in 2023, where there was a decrease in total current liabilities from 153,982 in 2022 to 145,308 in 2023—a decrease of 5.63%.
But why have Apple’s current liabilities been increasing every year?
Current liabilities comprise several types of liabilities, including accounts payable, short-term debt, cash dividends, and income tax owed.
A thorough analysis indicates a significant increase in all these liabilities for Apple, except for 2023, where they all decreased which resulted in an overall decrease in total liabilities.
The substantial increase in Apple’s current liabilities can be attributed to a rise in its short-term debt by 15% (from 2019 to 2023)—to fund its investments for growth purposes.
|
2023 |
2022 |
2021 |
2020 |
2019 |
|
|
Accounts Payable Growth |
-2.35% |
17.08% |
29.48% |
-8.52% |
– |
|
Short Term Debt Growth |
-35.78% |
54.60% |
15.81% |
7.56% |
– |
|
Income Tax Growth |
-13.26% |
32.86% |
50.07% |
-7.64% |
– |
|
Cash Dividends Paid Growth |
1.24% |
2.59% |
2.74% |
-0.27% |
– |
Data from Apple Inc. 10-K Form 2023, 2022, 2021
Apple has $0.81 of Debt for Every Dollar of Equity
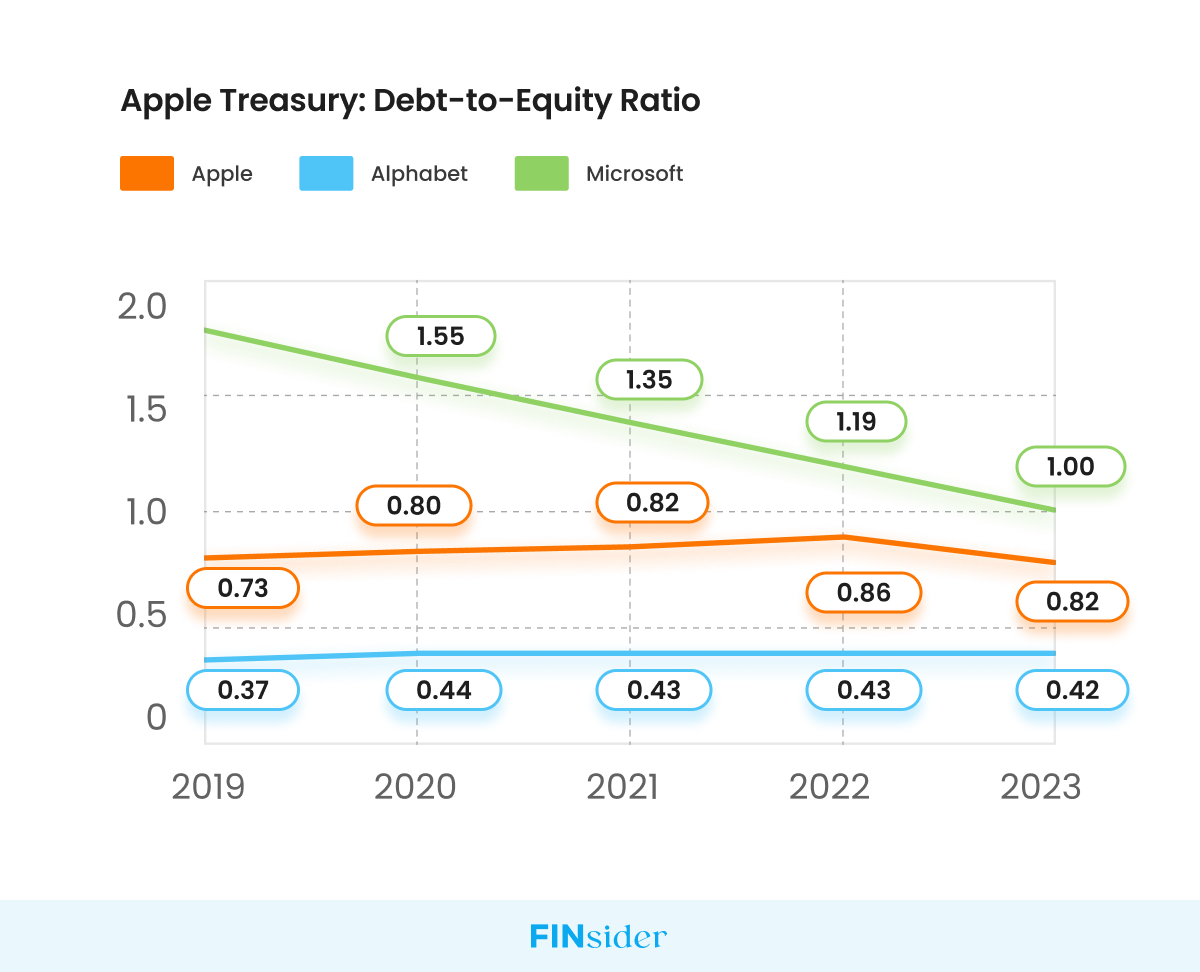
Apple has impressively maintained a robust average Debt-to-Equity ratio of 0.81 from 2019 to 2023. In comparison to Microsoft, Apple’s debt to equity ratio is better, falling in a low-risk zone, which is a clear indication of its sound financial health.
Another key aspect of managing a company’s treasury, like Apple, is managing foreign exchange risk—in addition to managing cash flow and debt. For Apple, fluctuating foreign exchange rates pose a significant financial risk. These fluctuations can have a substantial impact on revenue, especially in today’s economy where the interest rates are on the rise, strengthening the dollar.
Let’s examine Apple’s 10-K form data further and find out whether we can identify any patterns that hint at some of the strategies it uses to mitigate this risk.
How Apple Manages Foreign Exchange Risk?
In 2023, Apple generated a significant portion of its net sales revenue, 63.8%, from outside the US. This exposes the company to the potential risks of fluctuations in foreign currency exchange rates.
To address this risk, Apple has taken measures like using derivative instruments such as Foreign Exchange Contracts (FECs), also known as currency forward contracts. FECs are agreements between two parties that lock in the exchange rate for the purchase or sale of a currency on a future date.

Data from Apple Inc. 10-K Form 2023
Apple Hedges 96% of Overseas Revenue using FECs
Apple has stated in its 10-K form that the company usually hedges portions of its forecasted foreign currency exposures associated with revenue and inventory purchases. Our analysis of Apple’s 10-K forms for 2023, 2022, and 2021 shows that Apple has been proactive in hedging its foreign currency exposures.
- On average, from 2019 to 2023, the company has hedged a significant 96% of its non-US sales revenue using FECs.
- Additionally, we found that there were two instances in which Apple over-hedged, meaning that the value of FECs exceeded the actual net sales of non-US sales revenue in 2020 and 2022, respectively (see table below).
|
In USD million |
2023 |
2022 |
2021 |
2020 |
2019 |
|
Total FECs |
179,507 |
288,051 |
203,393 |
146,046 |
138,663 |
|
Net Sales (Non-US) |
232,014 |
246,469 |
232,014 |
129,040 |
157,908 |
|
FECs % of Non-US Sales |
77.37% |
116.87% |
87.66% |
113.18% |
87.81% |
Data from Apple Inc. 10-K Form 2023, 2022, 2021
Why Apple Over-hedged in 2020 & 2022?
- In 2020, Apple’s non-US net sales revenue was 18% lower than in 2019. However, the FECs were 113% of the Net Sales Revenue. One possible reason for this could be that Apple may have anticipated interest rates to increase, as trends like high inflation and a weakening USD against other currencies were observed. Interest rate hikes by the Federal Reserve tend to strengthen the US dollar. For Apple, a stronger dollar could reduce the competitiveness of its exports and decrease profits by making it costlier to convert foreign earnings into dollars.
- In 2022, FECs accounted for 116% of non-US net sales as Apple recorded its highest-ever sales revenue. Rising US interest rates and a strengthening dollar likely prompted Apple’s treasurers to hedge a larger portion of the forecasted net sales revenue, providing them with a buffer.
What Does the Future Hold for Apple's Treasury?
Looking ahead, it’s exciting to see how Apple’s treasury management will evolve to meet the demands of an ever-changing market. With the past five years serving as a testament to their consistent efforts to maintain financial health, we can expect Apple to continue employing effective financial strategies to mitigate any potential risks.
As the global economy continues to fluctuate, it’s likely that Apple will continue to use foreign exchange contracts to hedge against currency risk while managing its debt and liquidity. And with a focus on long-term stability over short-term gains, we can anticipate that Apple will maintain its consistent debt-to-equity ratio and controlled handling of its current liabilities in the years to come.
Overall, Apple’s steady approach to navigating the financial aspects of its operation offers a blueprint for other companies hoping to achieve similar financial steadiness. It will be interesting to see how Apple adapts to future market conditions and continues to set an example for other businesses.
 Linkedin
 Facebook
 Twitter
 Copy url


