Lululemon's Big Break: 4x Growth in FCF, Challenging Legacy Brands!
How have $100 leggings defied time? Lululemon financials rode the casualization wave, turning yoga wear into something "kind of sexy". This clever twist made their clothes perfect for yoga and errands alike. How is this success reflected on its cash flow statement? Let’s find out.
 Linkedin
 Facebook
 Twitter
 Copy url
79%
of Net Revenue from the Americas
72%
increase in CapEx in 2021
$2.3Bn
in FCF in 2023
$0.7
in Liabilities for every $1 in Equity

In the technical athletic apparel category, few names stand out as prominently as Lululemon. Celebrating its 26th anniversary in 2024, the company has built a robust portfolio of products—including running, training, and leisure wear.
This story is about Lululemon’s rise, about product innovation and market expansion through capital expenditure with a vision.
In this article, we will dive into Lululemon’s cash flow statement—examining key treasury metrics like Free Cash Flow (FCF), capital expenditures (CapEx), and other financial ratios. By analyzing Lululemon annual revenue and studying insights from the Lululemon annual report, we can uncover the financial strategies behind its success.
We will explore how the company’s strategic investments and financial prudence have propelled it from a niche yoga apparel boutique to a global giant. Let’s begin by analyzing Lululemon financials and its revenue streams first.
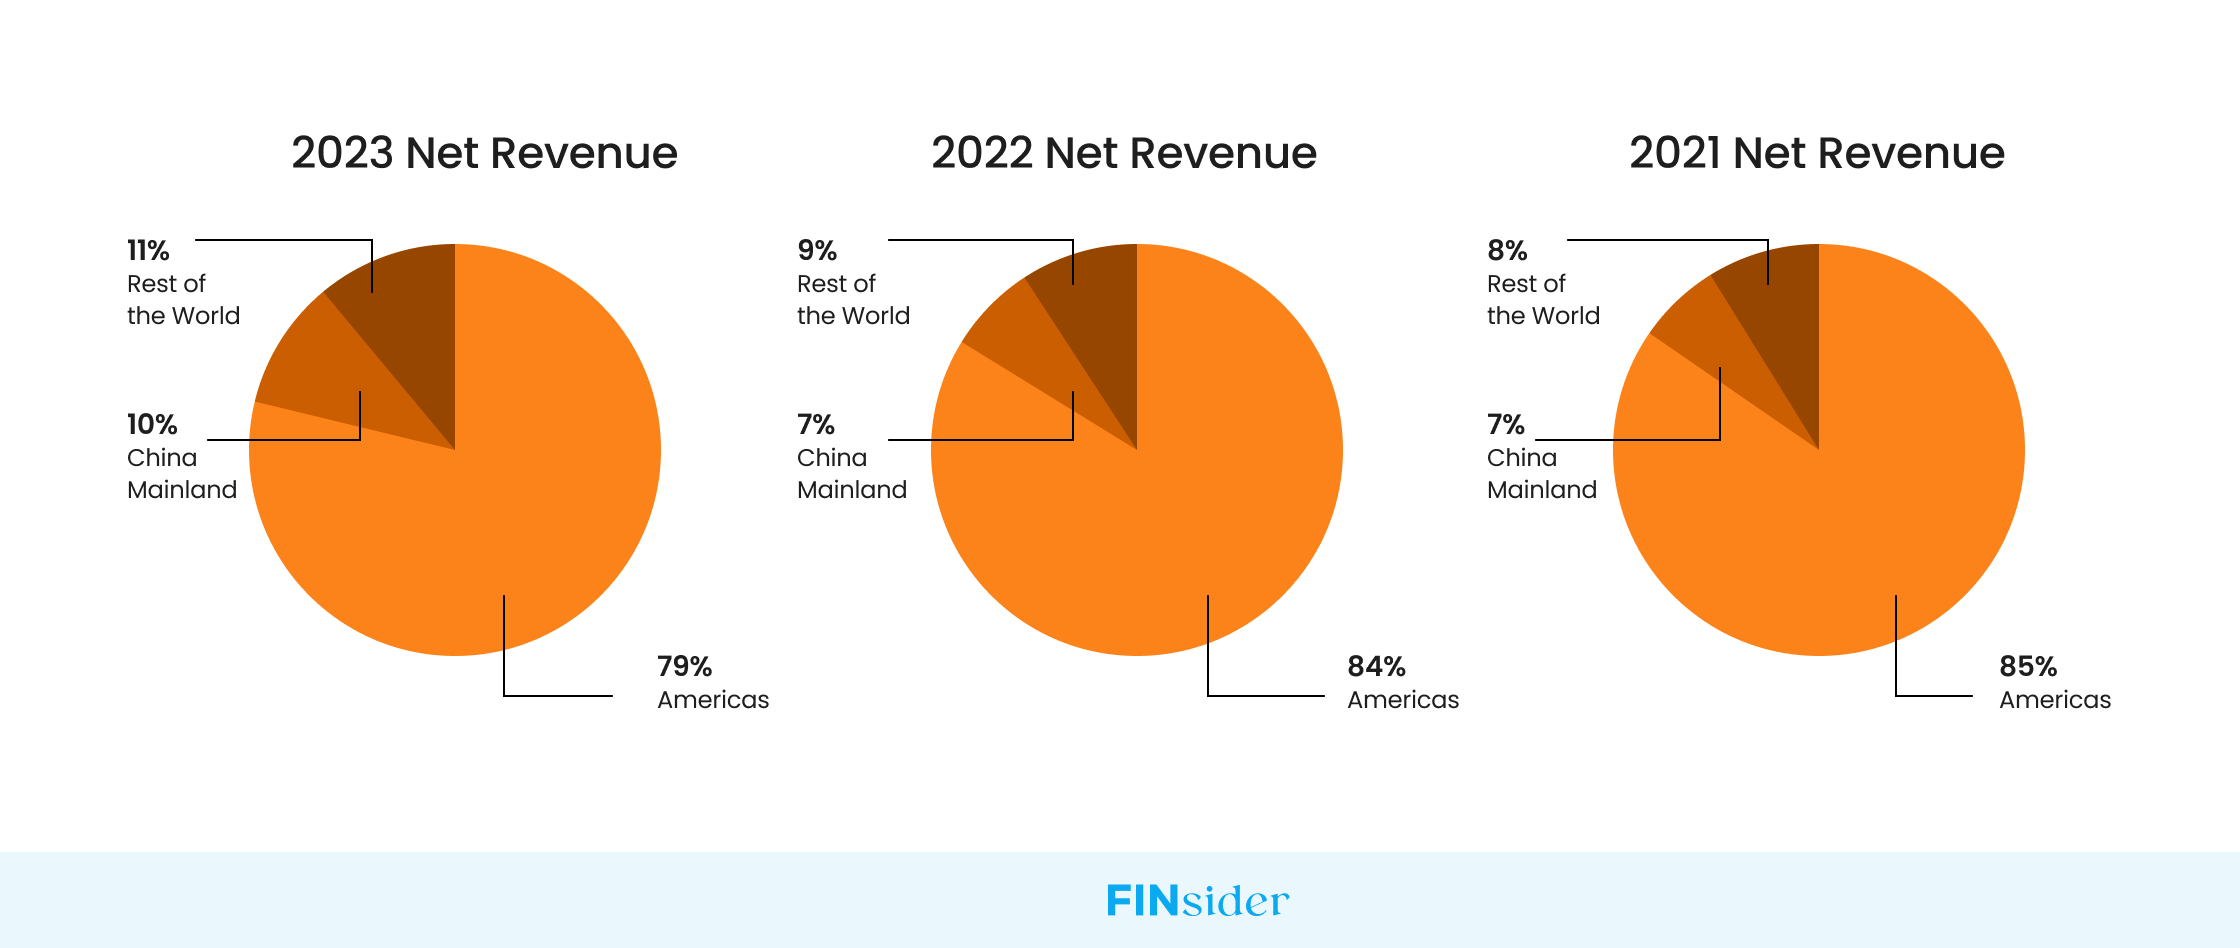
79% of Lulu’s Net Revenue comes from the Americas
Lululemon operates in over 25 countries and organizes its operations into four regional markets:
- Americas,
- China Mainland,
- Asia Pacific (APAC), and
- Europe and the Middle East (EMEA).
The company reports three segments: Americas, China Mainland, and the Rest of World (APAC and EMEA combined).
In 2023, the Americas accounted for 79% of net revenue, China Mainland 10%, and the Rest of World 11%. This is a shift from previous years where the Americas had a higher percentage of net revenue.
The company operates both physical retail locations and e-commerce services through its region-specific websites, digital marketplaces, and mobile apps. Physical retail locations are considered a key part of Lululemon’s growth strategy, helping build its brand presence while supporting omni-channel capabilities.
Having explored Lululemon’s global operations, let’s now dive into the company’s Free Cash Flow (FCF) metrics.
FCF Growth Rate is 4x the Industry Average

Lulu’s FCF is growing 44% YoY. Compared to the industry average of 11%, Lulu is growing 4x faster.
- The FCF Yield is 12%, which is 4 percentage points higher than the industry average.
- Cash from Operations is growing at 36% CAGR.
- CapEx in 2020 decreased by 19%. The next year, in 2021, it increased by 72%—and the following year, in 2022, it increased by 62%. In 2023, the growth rate was only 2%.
An increase in CapEx means more purchases of assets (property, plants, buildings, tech, or equipment).
Lulu’s Expenditures occurred in three major areas:
According to Lulu’s annual report for 2021[1], 2022[2], and 2023[3], the increase in capital expenditures was partly due to larger-scale projects and a continued shift to cloud computing/cloud migration:
- Company-operated stores: The company invested $189.6 million in 2021 and $134.2 million in 2020. These funds were used primarily for remodeling or relocating certain stores, opening new stores, and ongoing store refurbishment.
- Enhancing direct-to-consumer segment: The company spent $81.7 million and $37.2 million in 2020 and 2023 respectively. Investments here were primarily related to the company’s distribution centers as well as other “technology infrastructure and system initiatives” like the mirror gym[4].
- Corporate activities and other: These capital expenditures, which totaled $123.2 million in 2021 and $57.8 million in 2020, were primarily related to investments in cloud technology, business systems, and opening retail locations other than company-operated stores.
But, are these investments paying off in 2023?
In 2022, Lululemon faced a steep 67% drop in Free Cash Flow (FCF) compared to 2021. However, the company’s strategic investments soon bore fruit. By 2023, FCF had rebounded dramatically with a 400% increase, climbing to $1.64 billion from $328 million in the previous year.
Lululemon’s FCF yield averaged an impressive 12% from 2019 to 2023, well above the industry average of 8%. Additionally, cash from operations surged by 138% in 2023.
That’s impressive, but it is also essential to consider how the company leverages this cash flow to manage its debt obligations effectively. Let’s talk about that for a minute.
On average, 19% of Lulu’s Assets are Financed by Debt
Lulu’s total debt increased 17% YoY from 2019 to 2023. In the same timeframe, the industry’s total debt was increasing 19% YoY.
Let’s double-click on the data for deeper insights:
- In 2023, Lulu’s Total Debt was $1.4B
- In 2023, Lulu’s Total Assets were $7.1B.
- Lulu’s total assets increased 21% YoY from 2019 to 2023, while the industry’s total assets increased 10% YoY.
- Lulu’s 5-year average Debt Ratio was 19%, compared to Industry’s 40%.
Lulu’s total debt increased at a slower rate than the industry’s, while its total assets grew at a higher rate. This means in comparison to its peers in the industry, Lulu is less leveraged which is translated in the terms of Debt Ratio.
What could be the reason behind Lulu being less leveraged than its peers?
- Strategic Investment Decisions: Lulu’s strategic decisions on capital expenditures — such as opening new stores, remodeling and relocating existing stores, investing in technology, and making system enhancements — might be yielding good returns, reducing the need for debt financing.
- Risk Management: Lulu might be deliberately maintaining a lower level of debt as part of its risk management strategy. By doing so, it can ensure that it is not over-leveraged, thereby reducing its financial risk in the event of an economic downturn or a sudden decline in its business.
Now let’s talk in detail about Lulu’s ability to effectively service and manage the various financial liabilities that it owes.
Lulu has $0.7 in Liabilities for every $1 in Equity
In 2023, Lulu had a current ratio of 2.49. This means that for every $1 of current liability owed, Lulu has $2.49 in current assets. The industry average for the current ratio is 1.71.
In 2023, Lulu had a debt-to-equity ratio of 0.68. This means Lulu has $0.7 worth of liabilities for every $1 owned in equity by its shareholders. The industry average is 1.24.
Why does Lululemon enjoy an outstanding current and debt-to-equity ratio?
- Effective Liquidity Management: A current ratio above the industry average suggests that Lulu is effectively managing its short-term assets and liabilities. This could be due to efficient inventory management, timely collection of receivables, or strategic scheduling of payables.
- Profitable Operations: High profitability can lead to an accumulation of assets over time, increasing the current ratio. Lulu’s operations are more profitable than its peers, this could explain the high current ratio.
- Conservative Debt Policy: A debt-to-equity ratio lower than the industry average indicates that Lulu relies less on external debt for financing its operations. This could be a result of a conservative financing policy or a strategic decision to avoid the risks associated with high levels of debt.
Is Lululemon’s Treasury Ops Future-proof?
Lululemon’s strategic investments have positioned the company as a leader in the technical athletic apparel category. With an increasing free cash flow and robust solvency/liquidity metrics, the company is holding its ground against its peers.
But this remarkable growth, while impressive, comes with operational and technological challenges that can impact Lulu’s financial health—and can feel like an unwelcome burden. How will Lululemon integrate this financial expansion with visionary treasury processes?
This is a question that only their treasury department can answer, as they navigate the complexities of ensuring financial robustness and agility.
Source Links:


