1. Cash Insights
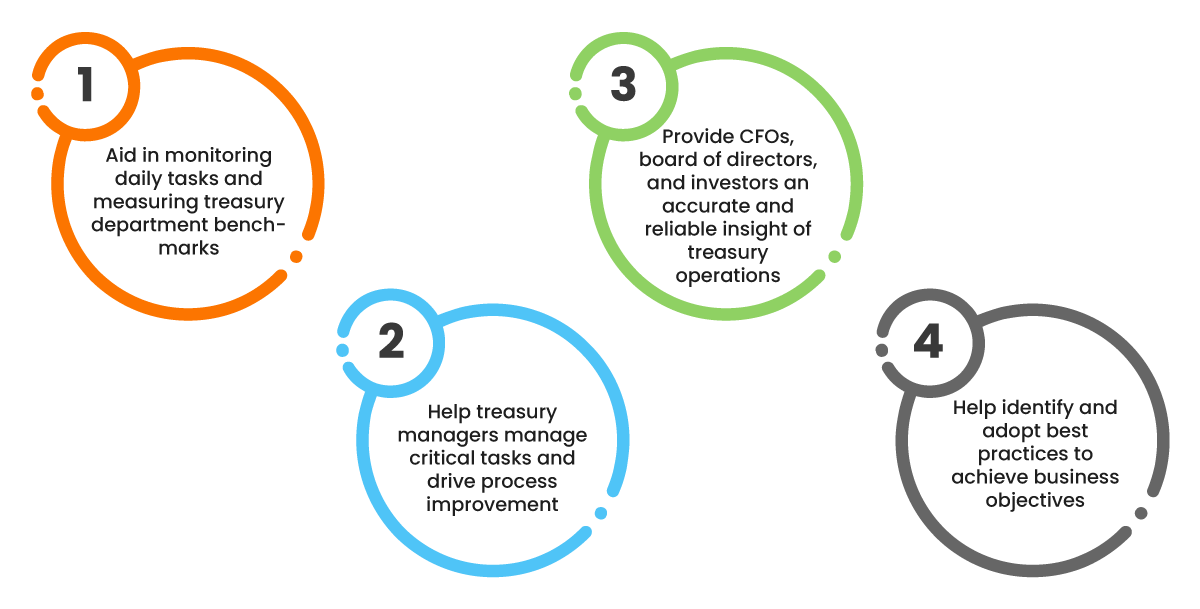
Cash insight KPIs and metrics indicate the cash health of your organization.
1.1 Cash Visibility Percentage
Visibility through a portal into all company bank accounts and balances.
Why measure it?
Clear cash visibility empowers treasurers to make effective decisions based on current and future liquidity:
- Invest cash strategically
- Support CFO in strategic initiatives with accurate knowledge of cash position.
- Use cash management structures effectively
- Reduce debt and interest expense
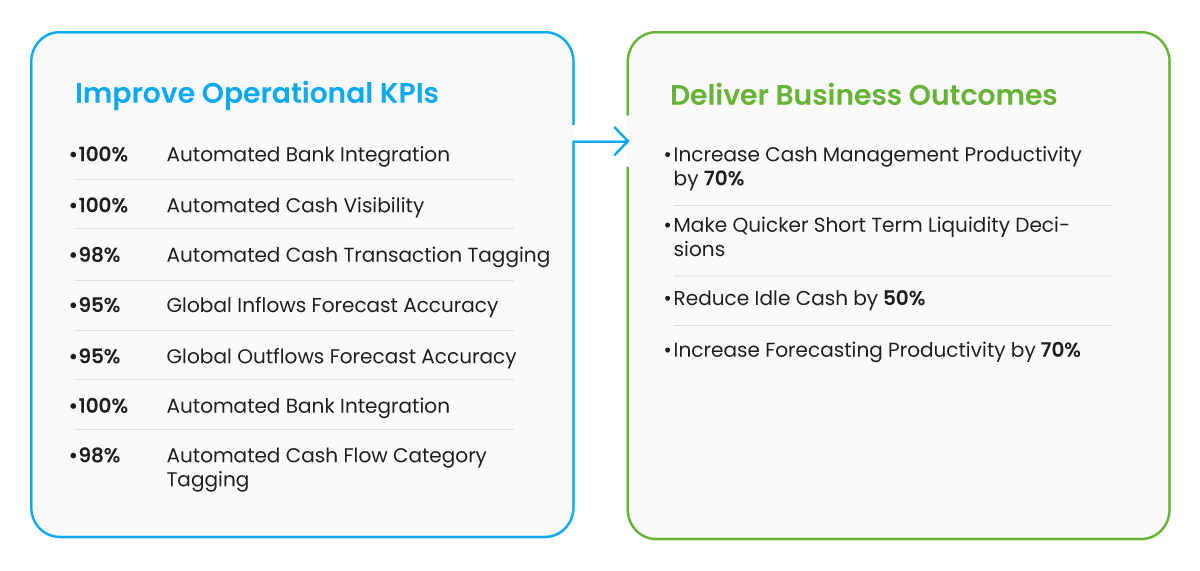
1.2 Automated Cash Visibility
A system automatically provides visibility through a bank portal into all company bank accounts, balances, and transactions.
Why measure it?
Enhanced transparency enables the identification of funds that can be utilized for debt paydown, capital expenditure, and business reinvestment.
1.3 Average Monthly Collected Balance
The global average amount of collected balances.
Why measure it?
It determines the amount of interest earned on a business account, as well as the fees that the bank charges every month. The higher the average collected balance every month, the more interest earned and the fewer fees charged each month.
1.4 The Global Average Monthly Collected Balance vs The Global Target Balance
The global average amount you intend to leave in accounts vs the amount that was left.
Why measure it?
It helps you identify if you can hold an optimal balance (the sum of all the cash you have in all bank accounts) in reserve at any given point in time for your business to run smoothly.
1.5 Percent of Restricted Cash vs. Total Cash
The global average amount you intend to leave in accounts vs the amount that was left.
Why measure it?
Understanding how much-restricted cash your company has is critical so your treasury can ensure you have enough liquidity to manage its operations. A high percentage of restricted cash could lead to needing more liquid money.
1.6 Cash or Revenue Ratio
Calculating this metric offers a conservative evaluation of a company’s ability to fulfill its debts and obligations as it focuses solely on cash or cash-equivalent holdings. It excludes other assets, such as accounts receivable, from the calculation.

Why measure it?
This metric shows the company’s capacity to promptly pay off all current liabilities without the need to sell or liquidate additional assets.
1.7 Days Cash Available

Why measure it?
This metric refers to the duration, measured in days, during which your organization can sustainably cover its operating expenses.
1.8 Percentage of Daily Cash Balances vs. Forecast

Why measure it?
By calculating the percentage of daily cash balances vs your forecast, you can verify the accuracy of your projected period. Any discrepancies serve as a signal to investigate daily cash flows further and identify the source of the disparity.
1.9 Percentage of Non-Interest Bearing Cash vs. Total Cash

Why measure it?
This ratio considers the proportion of non-interest-bearing accounts with the total accounts. Non-interest-bearing cash refers to liabilities issued by a business in exchange for cash, representing amounts owed by the company to a third party.
1.10 13-Week Cash Forecast

Why measure it?
The 13-week forecast enables businesses to anticipate their cash flow for an entire fiscal quarter. By demonstrating a credible forecast showcasing incoming cash flows companies can secure financing.
2. Investment/ Debt Management Insights
These KPIs and metrics help to quantify the investment performance of your organization better
2.1 Debt to Equity Ratio
It is calculated by dividing a company’s total debt by total shareholder equity.

Why measure it?
The debt-to-equity ratio depicts how much debt a company has compared to its assets. A higher debt-to-equity ratio states the company may have a more difficult time covering its liabilities.
2.2 Cost of Debt
The cost of debt refers to the total interest amount that a company or individual owes on outstanding liabilities, including bonds and loans. This expense can be measured as either pre-tax or post-tax cost of debt. The level of the cost of debt is determined by the borrower’s creditworthiness, with higher costs indicating a higher perceived risk associated with the borrower.

Why measure it?
This metric measures the effective interest rate that a company incurs on its existing debt. A lower cost of debt signifies a more advantageous borrowing environment for the company.
2.3 Debt Service Coverage Ratio (DSCR)
It is calculated by dividing a company’s total debt by total shareholder equity.

Why measure it?
The debt-service coverage ratio (DSCR) assesses a company’s available cash flow for meeting its current debt obligations. It provides investors and lenders with insights into whether the company generates sufficient income to repay its debts.
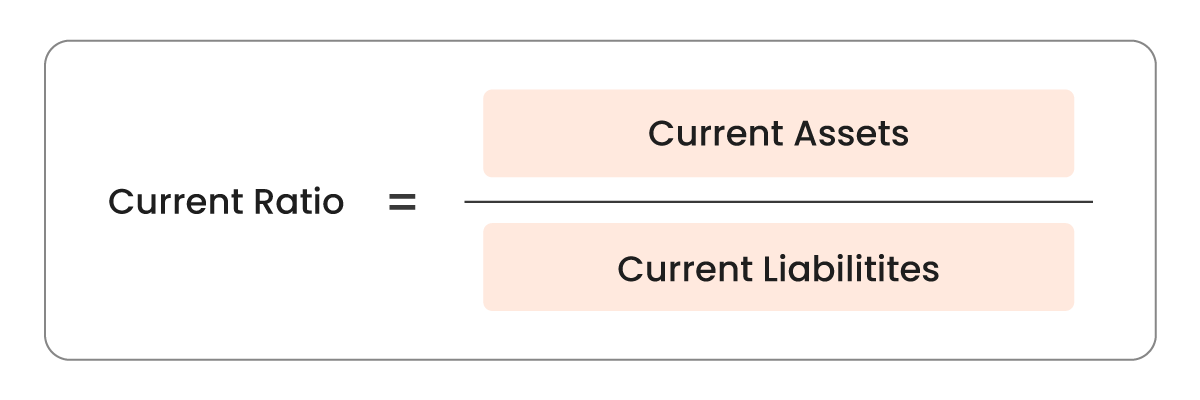
2.4 Current Ratio
The current ratio evaluates a company’s capacity to fulfill its immediate obligations (debts and payables) by utilizing its present assets (cash, inventory, and receivables) that are readily converted into cash.

Why measure it?
The metric assesses a company’s capacity to meet its immediate financial obligations or those that are due within a year. It provides insights to investors and analysts regarding how effectively a company can utilize its current assets listed in the balance sheet to settle its current debts and other payable liabilities.
2.5 Weighted Average of Cost of Capital (WACC)
A company’s weighted average cost of capital (WACC) is the amount of money it must pay to finance its operations.

Why measure it?
A company’s capital structure refers to the combination of debt and equity it utilizes to finance its operations. As debt and equity possess varying rates of return or costs of capital, it is crucial to consider these factors in determining the weighted average cost of capital (WACC).
3. Risk Management Insights
These KPIs and metrics help to mitigate the risks and manage them effectively.
3.1 Interest rate risk
Fixed-income assets, such as bonds, are primarily subject to interest rate risk rather than equity investments. This is because changes in interest rates have a significant impact on the price of a bond.
Why measure it?
Interest rate risk refers to the possibility of a decrease in the worth of an investment due to unforeseen changes in interest rates.
3.2 Currency Risk
Having assets or business operations spread across different countries exposes your company to currency risk, which can lead to unpredictable gains or losses.
Why measure it?
Fluctuations in exchange rates are a common occurrence over time, and holding a weakening currency can result in businesses losing value. However, implementing specific hedging strategies can assist in mitigating this risk.
3.3 Liquidity Risk
Liquidity risk entails the possibility of a business encountering challenges in fulfilling its immediate financial responsibilities because it is unable to convert its assets into cash without incurring significant losses.
Why measure it?
Liquidity issues can have several negative consequences, such as financial losses from selling assets at reduced prices, operational disruptions caused by insufficient cash flow, and reputation damage that further worsens the liquidity situation.
3.4 Operational Risk
Operational risk refers to the potential dangers and uncertainties a company encounters while carrying out its daily business operations and managing its treasury functions.
Why measure it?
One of the most significant operational risks that companies face is the potential failure of their information technology (IT) infrastructure, which can be caused by software bugs or viruses. Such an outage has the potential to disrupt payment systems, making it impossible to process transactions. In addition to external threats like computer hackers, there is also a risk of internal dangers from employee theft or fraudulent activities.
3.5 Cash Flow Forecast Accuracy
Cash flow forecasting assists businesses in organizing their cash inflows and outflows. By estimating future cash flows using historical data and business trends, companies can make more informed choices regarding the allocation of their resources.

Why measure it?
This metric evaluates the accuracy of predicted versus actual cash flow, providing teams with insights into their ability to forecast inflows and outflows. Its significance lies in aiding teams in identifying opportunities to enhance their forecasting methodologies.


