Dell vs. HP Financial Efficiency : Inventory Advantage of Dell Trumps HP in AR Management
In the Dell vs HP showdown, speed is key. Dell's swift inventory turnover gives it an advantage, but HP is hot on its heels, building better supplier relations. Who's going to be the ultimate accounts receivable champ? Let's find out.

9-day
shorter cash cycle for Dell
2.5x
higher DPO for HP vs Dell
2.5x
higher DIO for HP vs Dell
15-day
faster cash collection by HP
Dell and HP are the most popular names in the computer manufacturing industry, with products like the Dell XPS laptops and HP's LaserJet printers found in homes and offices worldwide.
While comparisons often focus on the performance of their hardware devices, another important area to consider is their order-to-cash metrics. Imagine these metrics as the financial heartbeat of a company, revealing how swiftly it clears inventory (DIO), pays its suppliers (DPO), and collects payments from customers (DSO).
In other words, these metrics reveal the strength of a company’s financial operations.
In this article, we’ll delve into Dell and HP's order-to-cash metrics from 2019 to 2023 to determine which company manages its cash cycle most effectively.
Let’s get started by analyzing the Cash Conversion Cycle first!
Dell Converts Inventory to Cash 9 Days Faster Than HP

Dell and HP's cash conversion cycle (CCC) data from 2020 to 2024 reveal significant differences in cash management efficiency:
Dell's cash conversion cycle:
- Varies widely, ranging from -48 days (2022) to -39 days (2020)
- Average CCC: -41 days
- Indicates strong performance in quick cash conversion
HP's cash conversion cycle:
- Ranges from -28 days (2023) to -36 days (2024)
- Average CCC: -32 days
- Higher than Dell's average
Dell performs better on the CCC basis. The lower average CCC (-41) compared to HP (-32) means that Dell can turn its inventory into cash faster.
This shows how long Dell and HP take to receive cash. To understand their accounts receivable, inventory management, and accounts payable better, let's look deeper into metrics like DPO, DSO, and DIO.
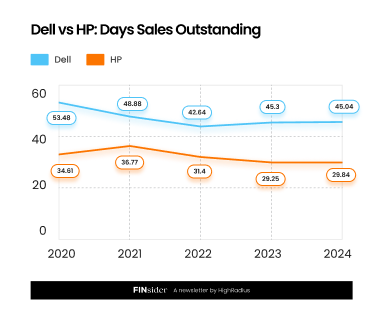
HP collects payment from its customers 15 Days earlier than Dell

For both Dell and HP, the DSO remained relatively stable over the years, with some variations.
In 2020, HP and Dell had a DSO of 32 days and 47 days respectively. From 2021 to 2024, their DSO decreased slightly, with Dell's DSO reaching 45 days in 2024, compared to HP's 30 days in the same year.
Overall, Dell’s average DSO over the period is 47 days, 15 days higher than HP's average of 32 days. This suggests that, on average, HP collects payments from customers a bit faster than Dell.
How HP collects payments faster than Dell?
According to HP’s 2023 10K form[1]:
- Allowance for credit loss: HP maintains a credit loss fund for customers by evaluating factors such as third-party credit risk models, customer financial health, overdue payment duration, portfolio risk trends, economic conditions, competition, major events, and past experiences. Payment overdue status is determined by agreed terms.
- Leveraging “Multiple” Sales Channels: HP relies on value-added resellers, system integrators, distributors, and retailers as sales channels to complement its direct sales, allowing it to reach more end-users. By effectively managing these relationships, HP has ensured a healthy DSO.
Now that we've examined how HP collects payments faster from its customers than Dell, let’s analyze Days Inventory Outstanding (DIO) next.
Dell sells its inventory 7 Days faster than HP

Looking at the numbers, Dell generally has a lower DIO than HP, indicating that Dell sells its inventory more quickly.
For example, in 2023, Dell's DIO was 23 days, while HP's was 63 days. This pattern is consistent across the previous years, with Dell always having a lower DIO. On average, Dell’s DIO over these five years is 21 days, whereas HP's is 52 days.
This suggests that, on average, HP took a bit longer than Dell to sell its inventory during this period.
How Dell manages to clear its inventory faster than HP?
According to Dell’s shareholder letter[2]:
- Dell actively manages its stock to avoid holding onto items that could become outdated or are in excessive quantities.
- Dell regularly reviews its inventory based on demand forecasts, product life cycles, and current sales levels.
By keeping track of these factors, Dell can identify and sell inventory that might otherwise lose value. If market conditions or demand changes, Dell is prepared to adjust by selling inventory quickly to avoid losses.
This approach helps Dell maintain lower Days Inventory Outstanding (DIO) compared to HP, which might not manage its inventory as closely.
That being said, another important metric to consider is Days Payable Outstanding (DPO), which will help us gauge the supplier relationships of the two companies.
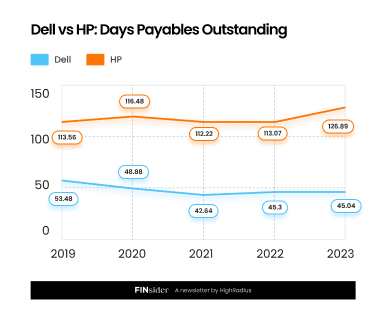
Dell Clears Its Dues with Suppliers 69 Days Earlier Than HP

In 2019, Dell had a DPO of 53 days while HP took 114 days.
On average, over these five years, Dell’s DPO was 47 days, much lower than HP’s average of 116 days, indicating that Dell generally takes less time to pay its suppliers compared to HP.
How Dell Maintains a Lower DPO Than HP?
Dell has a lower Days Payable Outstanding (DPO) than HP likely because of differences in their working capital management strategies and business practices.
According to Dell’s 10K report for 2024[3]:
- Supplier-friendly Payment Terms: Dell focuses on building mutually agreeable agreement terms and good relationships with its suppliers that result in shorter payment terms. They prioritize maintaining strong supplier relationships by paying them more promptly.
- Less Aggressive Working Capital Management: Unlike HP, which may be extending its DPO as part of a broader strategy to manage cash flow, Dell seems to maintain a more balanced approach, valuing liquidity less aggressively than HP.
These factors together could explain why HP typically pays its suppliers more quickly than Dell.
Final Words: Whose AR efficiency is better, Dell or HP?
From 2019 to 2023, Dell consistently demonstrated greater financial efficiency than HP in several key areas, particularly in the cash conversion cycle (CCC), payment collection (DPO), and inventory management (DIO). Overall, HP's strength lies in its payment collection strategy.
In inventory management, Dell was more effective by reducing the risks associated with holding excess stock. This approach kept their operations lean and more responsive to market changes.
Additionally, Dell excelled in managing supplier payments, typically paying its suppliers more promptly than HP, which likely helped maintain strong relationships with suppliers and ensured a steady supply chain.
However, HP's robust payment collection strategy and consistent supplier payments highlight its commitment to financial stability. This focus on maintaining strong supplier relationships and efficient cash flow management positions HP as a reliable and stable player in the industry.
Both companies' strategies contribute to their competitive edges, each excelling in distinct aspects of accounts receivable management.
Source Links:
Want more insights? Subscribe to our finance newsletter for the latest in finance—from the best finance newsletters and compelling finance stories to treasury, R2R and AR insights.

 Linkedin
 Facebook
 Twitter
 Copy url


